
Explore New Jersey counties with our Compare Tool: Atlantic (Pop: 275,340, Tax: 2.82%, Home Value: $371,567), Bergen (Pop: 957,620, Tax: 2.05%, Home Value: $750,485), Camden (Pop: 527,190, Tax: 3.27%, Home Value: $344,483), and more. Compare population, tax rates, school counts, income, and median home values across 21 counties, and generate instant PDF reports for informed property decisions.
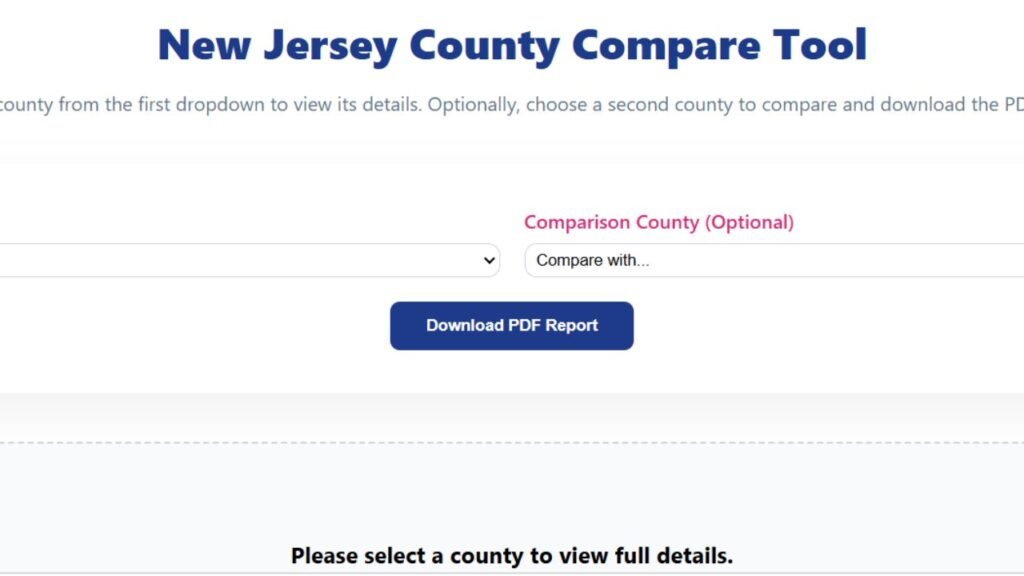
New Jersey County Compare Tool
Select a county from the first dropdown to view its details. Optionally, choose a second county to compare and download the PDF report.
Please select a county to view full details.
How the New Jersey County Compare Tool Works
Our New Jersey County Compare Tool allows users to select one or two counties to instantly compare important real estate and demographic data. The tool provides key insights like population, tax rates, school count, income, and median home value. Users can view details in interactive cards and even download a PDF report for reference.
Population
This shows the total number of residents living in the county as of 2025. Understanding population helps gauge county size, growth trends, and community density. Higher populations may indicate more developed areas, while smaller counties might offer quieter residential environments.
Area
Area represents the total land in square miles for each county. It helps users understand the geographic size, population density, and distribution of properties. Larger areas may include rural or suburban communities, while smaller counties are often more urbanized.
Tax Rate
The tax rate indicates the percentage of property tax residents pay annually. This is critical for homeowners and investors to estimate yearly costs and compare affordability between counties. Higher rates might reflect better services but increased expenses, while lower rates could indicate cost savings.
Total Parcel
Total parcels represent the number of distinct properties or land plots within a county. This includes residential, commercial, and vacant properties. It helps users understand the real estate market size and availability of homes, as well as the density of development across the county.
School
This shows the number of schools or school districts in the county. It helps families assess educational resources and quality of local education. Counties with more schools may offer better access to education and a variety of programs for students.
Home Age
Home age provides the typical or average year when residential properties were built. It gives insight into the housing stock, architectural styles, and potential maintenance needs. Older homes may require renovation, while newer homes may offer modern amenities.
Property Sales
This metric shows the number of homes sold in a county over a specific period. It indicates real estate activity, demand, and market trends. Higher sales reflect active markets, while lower sales may show slower turnover or less buyer activity.
Income
Income reflects the per capita income of residents in the county. This provides insight into economic conditions, affordability, and lifestyle standards. Higher income areas often correlate with higher home values and greater purchasing power.
Foreclosure
Foreclosure shows the rate of properties in legal distress due to unpaid mortgages. This data helps investors identify potential opportunities and risks. Counties with higher foreclosure rates may offer lower-cost homes but higher investment risk.
Home Value
Median home value represents the typical price of homes in a county for 2025. It helps users assess market affordability, investment potential, and property worth. Comparing home values across counties allows for informed buying or selling decisions.
Conclusion
The New Jersey County Compare Tool simplifies property research by offering clear, side-by-side insights for all 21 counties. Users can compare population, tax rates, school resources, income, and home values quickly. This empowers homeowners, investors, and real estate professionals to make informed decisions and plan purchases with confidence using official county data.
FAQ’s
What is the New Jersey County Compare Tool?
The tool is an interactive platform that lets users compare demographic, economic, and real estate data across New Jersey counties. You can select one or two counties, view detailed information, and generate a downloadable PDF report for analysis or reference.
How do I compare two counties?
Simply select your primary county in the first dropdown and an optional comparison county in the second. The tool will instantly display both county details side by side for easy comparison of population, tax rate, schools, home value, and more.
What data does the tool provide?
The tool provides 10 key data points: Population, Area, Tax Rate, Total Parcels, Schools, Home Age, Property Sales, Income, Foreclosure, and Median Home Value. These metrics give a full picture of each county’s real estate and demographic profile.
Can I download the comparison as a PDF?
Yes! After selecting the counties, click the Download PDF Report button. The tool generates a professional PDF with all selected county details, perfect for offline review, sharing, or record-keeping.
How accurate is the data?
The data comes from official county and government records for 2025, including population estimates, property taxes, and home values. While the tool provides accurate insights, always verify specific property details with local authorities when making financial decisions.